
Code&Data Insights
[Tableau Desktop Specialist Certification] Exam Prep - Domain 4 : Understanding Tableau Concepts (중요 내용 정리 - Dimension/Measure/Discrete/Continuous) 본문
[Tableau Desktop Specialist Certification] Exam Prep - Domain 4 : Understanding Tableau Concepts (중요 내용 정리 - Dimension/Measure/Discrete/Continuous)
paka_corn 2023. 8. 30. 08:56Domain 4: Understanding Tableau Concepts
4.1 Understand dimensions and measures
1) Explain what kind of information dimensions usually contain
- it contains qualitative values (such as names, dates, or geographical data). You can use dimensions to categorize, segment, and reveal the details in your data.
- Dimensions affect the level of detail in the view.
=> level of detail in a view : how granular the data is given the dimension and measure data in the view.
=> If more dimension are added to the view, the level of detail in the view increase!!
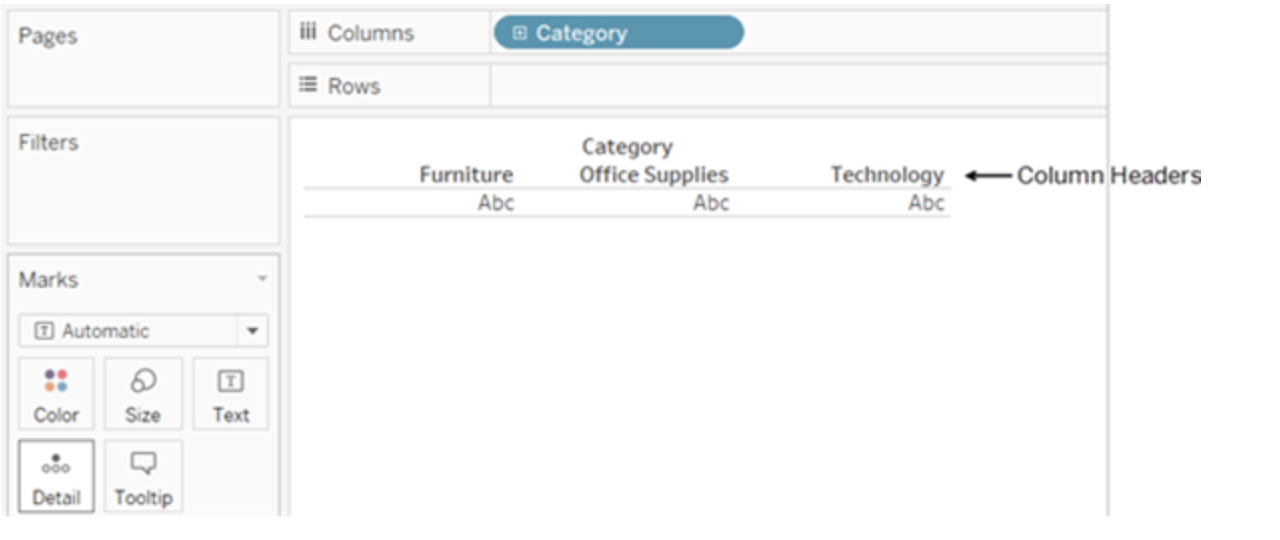
- when you drag a discrete dimension field to Rows or Columns, Tableau creates column or row headers.
2) Explain what kind of information measures usually contain
- it contains numeric, quantitative values that you can measure. Measures can be aggregated. When you drag a measure into the view, Tableau applies an aggregation to that measure (by default).
3) Explain the difference between dimensions and measures
=> dimensions are used for categorical and descriptive attributes that help organize and label data, while measures are used for numerical values that are subject to analysis, aggregation, and calculations
=> Measures contain quantitative values whereas Dimensions contain names, dates or Geographical data
=> Dimensions increase the level of detail in the view while measures are aggregated when added to the view.
difference 1 : filter
- Filter categorical data (dimensions)

- Filter quantitative data (measures)

difference 2 : color
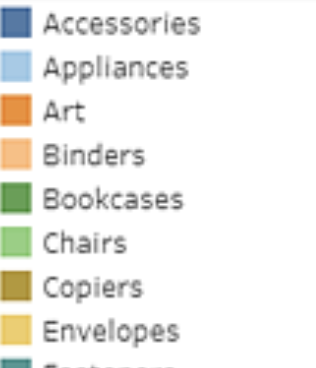
- When you drop a discrete field on Color in the Marks card,
Tableau displays a categorical palette and assigns a color to each value of the field.

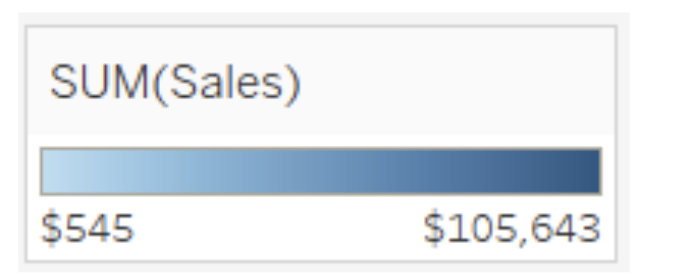
- When you drop a continuous field on Color,
Tableau displays a quantitative legend with a continuous range of colors.
4.2 Understand discrete and continuous fields
1) Explain how discrete fields are displayed
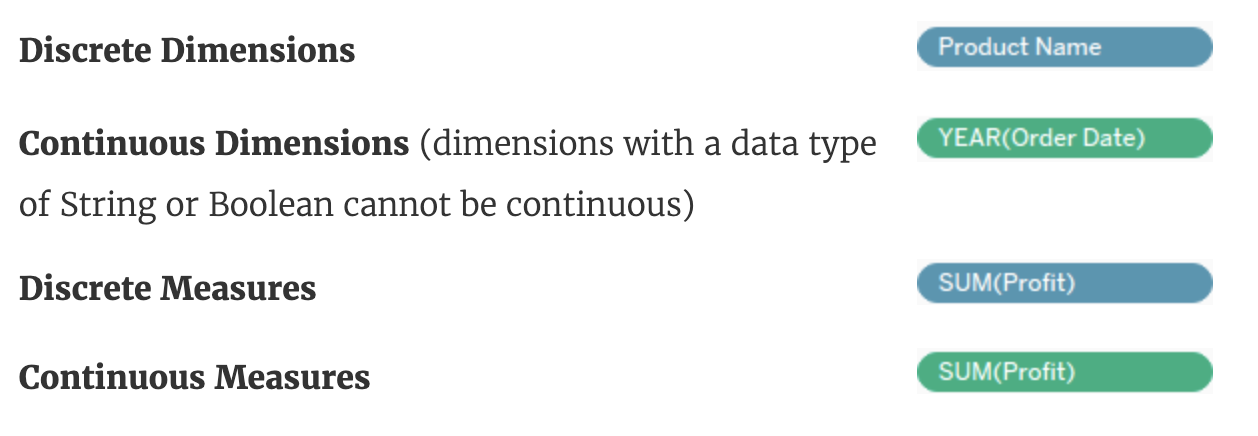
- blue pill indicates 'the field is 'discrete'
- discrete fields create headers
- the display of Discrete Field while dragged to Color in Marks Card
=> When dragged to the color of Marks Card, Tableau displays both the categorical palette and a legend with a color for each value of the field.
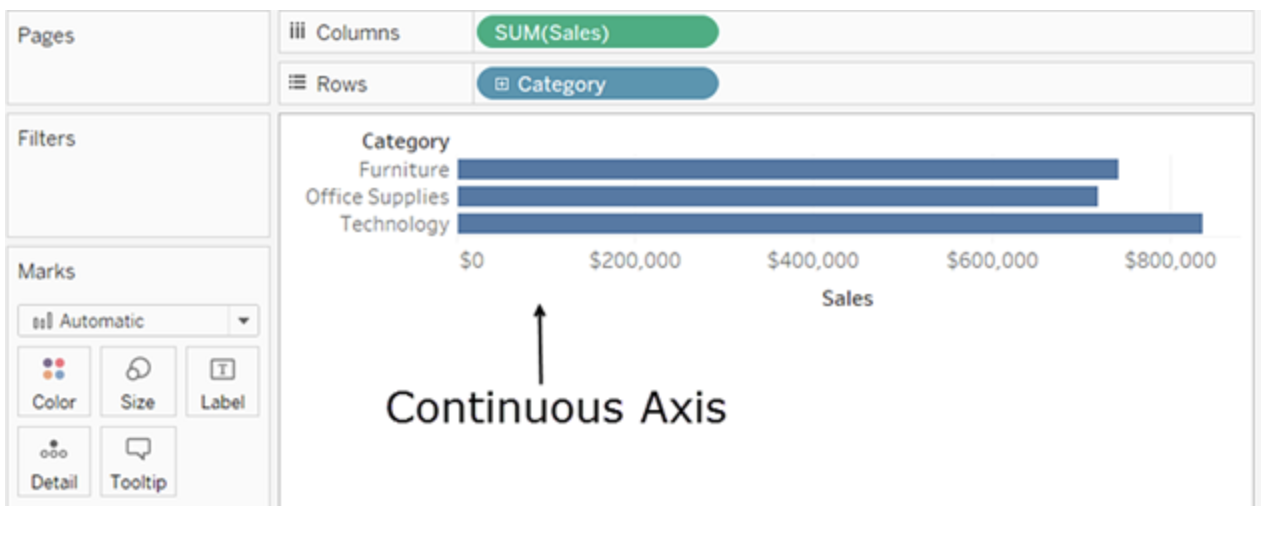
2) Explain how continuous fields are displayed
- green pill indicates 'the field is 'continuous'
- create an axis when it is added to the view
3) Explain the difference between discrete date parts and continuous date values
- Discrete date part color is Blue whereas the Continuous date part color is Green
- Discrete date creates labels whereas the Continuous date creates axes
- Discrete date aggregates data at the selected unit whereas the Continuous date uses individual date values
4.3 Understand aggregations
1) Explain the default aggregation for measures
- default aggregation in measure : SUM([measure]) /

- To change the default aggregation
: Right-click (control-click on Mac) a measure in the Data pane and select Default Properties > Aggregation, and then select one of the aggregation options.
2) Describe how an aggregated measure changes when dimensions are added to a view
- can aggregate a dimension in the view as Minimum, Maximum, Count, or Count (Distinct).

reference
https://help.tableau.com/current/pro/desktop/en-us/datafields_typesandroles.htm
https://help.tableau.com/current/pro/desktop/en-us/calculations_aggregation.htm


