
Code&Data Insights
[Book] Hands On Machine Learning with Scikit Learn and TensorFlow - Chapter 2:End-to-End Machine Learning Project 본문
[Book] Hands On Machine Learning with Scikit Learn and TensorFlow - Chapter 2:End-to-End Machine Learning Project
paka_corn 2023. 11. 27. 13:32Main Steps in Machine Learning Project
1. Look at the big picture
2. Get the data
3. Discover and visualize the data to gain insights
4. Prepare the data for ML algorithms (data cleaning, preprocessing)
5. Select a model and train it
6. Fine-tune the model
7. Present your solution
8. Launch, monitor, and maintain your system
1. Look at the Big Picture
- Frame the Problem(business objective)
: what algorithms you will select, what performance measure you will use to
evaluate your model, and how much effort you should spend tweaking it.
- Pipelines
: sequence of data processing components
=> Each component operates quite independently.
=> The interface between components is simply the data store.
- Select a Performance Measure
=> regression : RMSE
=> classification : CE
2. Get the Data
- Take a Quick Look at the Data Structure
value_counts() :for the categorical attribute, to know how many districts belong to each category
describe() : summary of the numerical attributes(count, mean, min, and max)
- Create a Test Set
: put the test set aside from training set
Data Snooping Bias : If the model is selected or adjusted based on specific features of the test data, it may become overfit to those features and fail to generalize well to new, unseen data.
stratified sampling - avoid sampling bias, better than random sampling
(from sklearn.model_selection import StratifiedShuffleSplit)
3. Discover and visualize the data to gain insights
- Visualizing Geographical Data
=> scatterplot (latitude and longitude)
- Looking for Correlations
=> compute the standard correlation coefficient (also called Pearson’s r) between every pair of attributes
using the corr()
=> The correlation coefficient ranges from –1 to 1. When it is close to 1, it means that there is a strong positive correlation.
=> Close to 0 : NO correlation
- Experimenting with Attribute Combinations
* What is Data Visualization?
- Using visual tools to discern patterns, features, relationships, and trends in data.
- Raw data need to be encode to the view(data viz) for human understanding
- Make a story of the data ‘grammar of graphics’

Most common problem
- Omitting baselines ( ignore the existing solution )
=> Baseline : what we want to achieve
=> Compare my model to existing solutions *good!
* What is EDA?
- EDA(Exploratory Data Analysis) :

- Visual EDA
=> Variation
: bar chart / histogram, density
=> Association - Covariance| Correlation
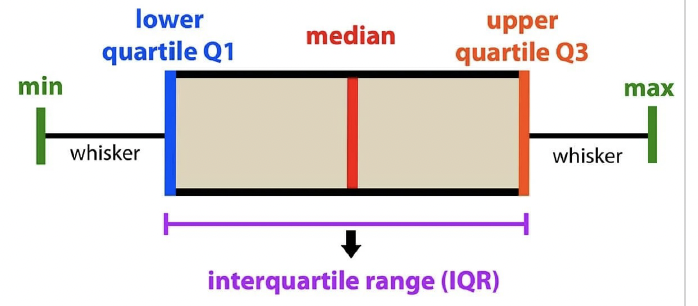
: scatter plot / box plot / facets
box plot
- can do continuous vs. categorical values
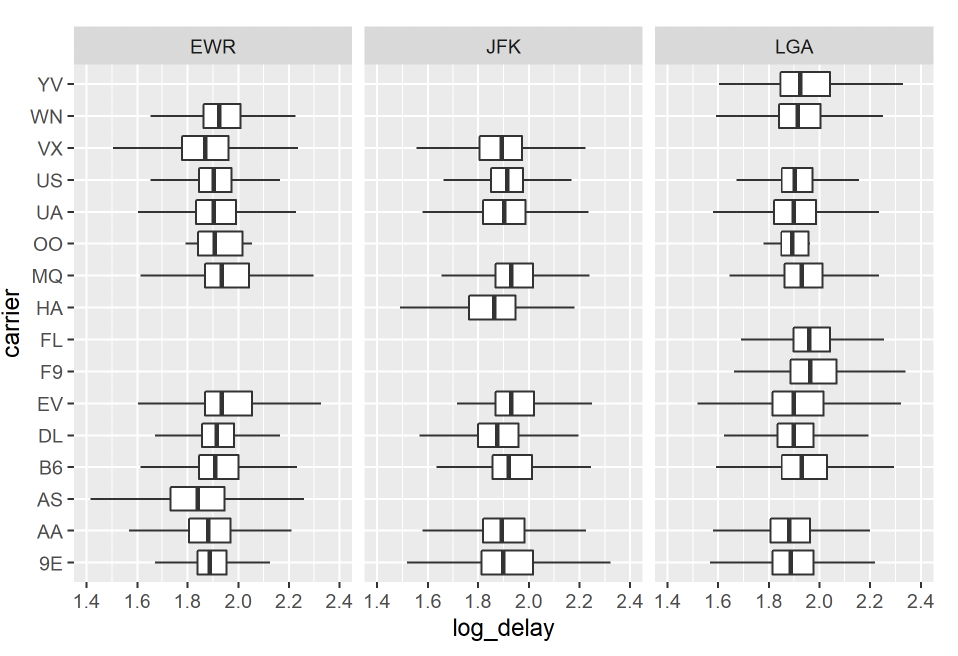
facets
- can do continuous vs. categorical values
In EDA, we generate new insights ! => Confirmatory -> Exploratory
4. Prepare the data for ML algorithms (data cleaning, preprocessing)
* Data Cleaning
- drop uncorrelated columns or fill missing values with median
- Handling Text and Categorical Attributes (Label Encoding, One-Hot Encoding)
=> LabelBinarizer
- Custom Transformers
- Feature Scaling
=> MinMaxScaler / StandardScaler
- Transformation Pipelines
=> FeatureUnion
5. Select and Train a Model
- Training and Evaluating on the Training Set
- Better Evaluation Using Cross-Validation
=> K-fold cross-validation
- Ensemble Learning - Bagging / Boosting
- Check the performance on traninig/validation set
=> if overfitting, perform regularization, or simplify the model, or feed more data
- Confusion Matrix

selected elements
- f1 score

==> by this measure(classification report), can see the class distributaion aside accuracy
*data imbalance*
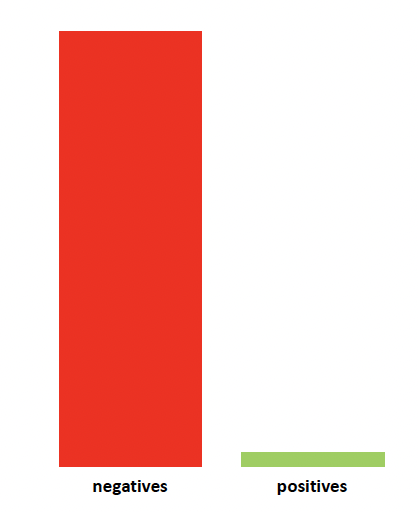
==> To address this issue?
- feed more data
- delete few data from the majority class
- create synthetic data
=> random oversampling - minority class
=> random undersanpling - majority class
BUT, problems can be arised such as Loss of information or Overfitting
6. Fine-Tune the Model
- Grid Search / Randomized Search
: find the best hyperparameters


